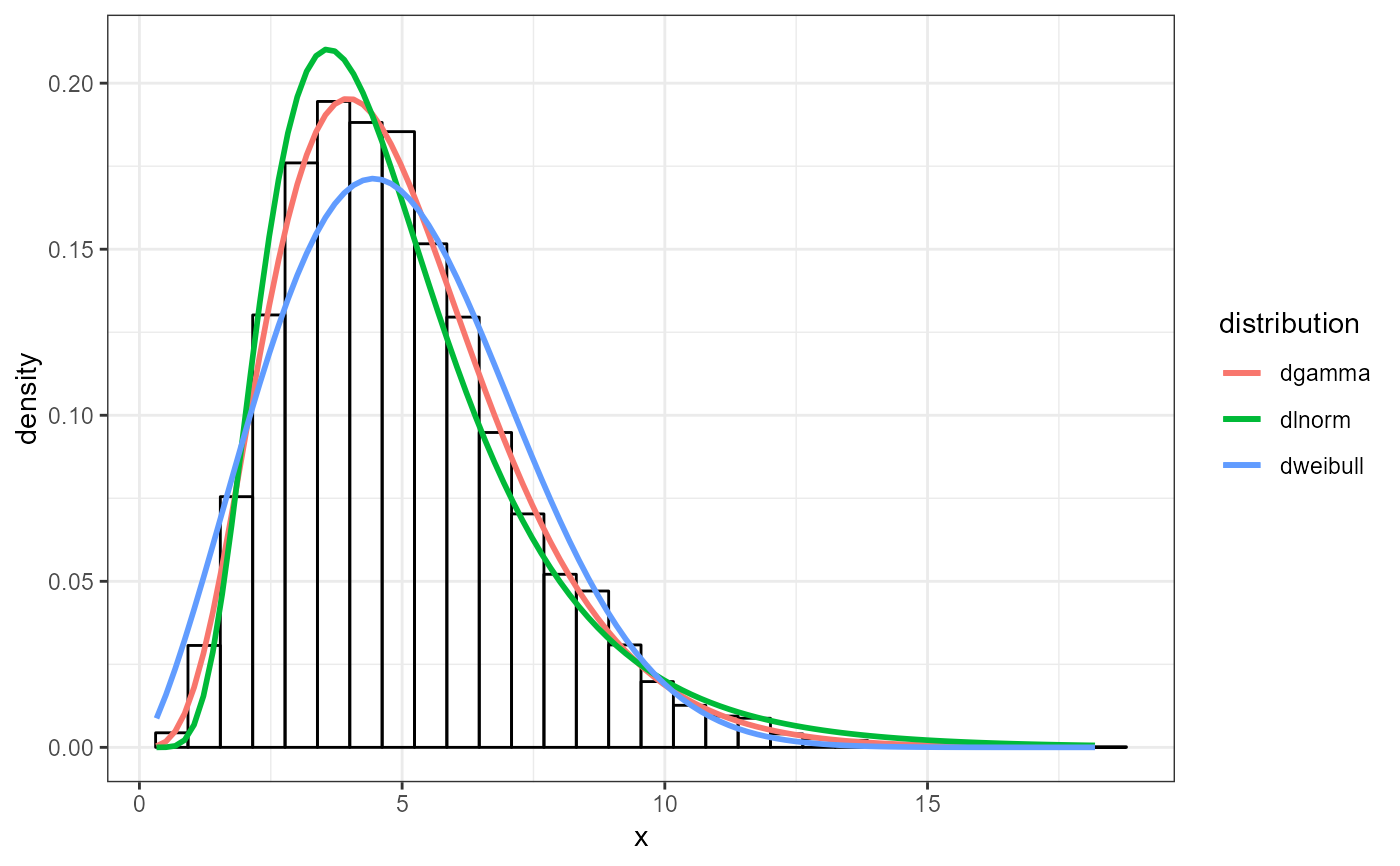
Density Comparison Plot
plot_density(x, fits, nbins)Arguments
- x
numeric vector of sample data
- fits
a list object produced from fit_univariate, fit_empirical, or fit_univariate_man
- nbins
number of bins for histogram
Value
ggplot of empirical histogram of x compared to theoretical density distributions